
6
Process for Developing Recommendations for Meal Requirements
This chapter describes the approach the committee used in developing recommendations for revisions to Meal Requirements for the Child and Adult Care Food Program (CACFP). The bulk of this chapter describes the processes used in developing recommendations for Meal Requirements for children over the age of 1 year, adolescents, and adults. The process that was used in developing recommendations for infants is described at the end of the chapter. A comparison of the consistency of the recommended Meal Requirements with the committee’s criteria is provided in Chapter 10.
CRITERIA
To guide its work the committee developed a set of criteria, shown in Box 6-1. These criteria provided an overarching framework that the committee used in developing, evaluating, and finalizing its recommendations.
OVERALL APPROACH TO DEVELOPING RECOMMENDATIONS
The committee’s approach to developing recommendations for CACFP Meal Requirements for children ages 1–18 years and adults ages 19 years and older was based on the approach used by the Committee on Nutrition Standards for the National School Lunch and Breakfast Programs (hereafter called the School Meals committee) (IOM, 2010). The process included several steps:
|
BOX 6-1 CACFP Criteria Criterion 1. The Meal Requirements will be consistent with current dietary guidance and nutrition recommendations to promote health with the ultimate goal of improving participants’ diets by reducing the prevalence of inadequate and excessive intakes of food, nutrients, and calories.
Criterion 2. The Meal Requirements will provide the basis for menus that are practical to plan, purchase, prepare, and serve in different settings. Criterion 3. The Meal Requirements will provide the basis for menus that incorporate healthful foods and beverages and are appealing to diverse age ranges and cultural backgrounds. Criterion 4. The Meal Requirements will facilitate the planning of menus that are compatible with the capabilities and resources for the variety of program providers. Criterion 5. The Meal Requirements will allow the planning of menus that are sensitive to considerations of cost. |
-
Set age groups and total daily mean calorie requirements for each group. The methods used to initially set these parameters are described in the section “The Determination of Age Groups, Body Weights and Heights, and Estimated Calorie Requirements” in Chapter 3. The final age groups used for developing the Meal Requirements reflect the committee’s decision to combine groups with similar nutrient and calorie requirements. The final age groups are shown in Table 6-1.
-
Assess dietary intakes and consider relevant laboratory data and health effects of inadequate or excessive intakes to identify the food and nutrient intakes of concern for specified age groups. Dietary intakes included food groups, food subgroups, calories, and nutrients. Chapter 3 presents the methods used to examine intakes. These methods are consistent with those recommended by the
-
Institute of Medicine (2000). Chapter 4 presents the findings for infants and children, and Chapter 5 presents the findings for adults.
-
Develop calorie and nutrient targets for each meal and snack. In developing these targets, the committee used methods recommended in the report Dietary Reference Intakes: Applications in Dietary Planning (IOM, 2003) when applicable. The targets are described later in this chapter.
-
Develop meal patterns and food specifications for planning meals and snacks that are aligned with the nutrient targets and the Dietary Guidelines. Apply the criteria (Box 6-1) in an iterative fashion to evaluate and finalize the recommended Meal Requirements. The recommendations are presented in Chapter 7.
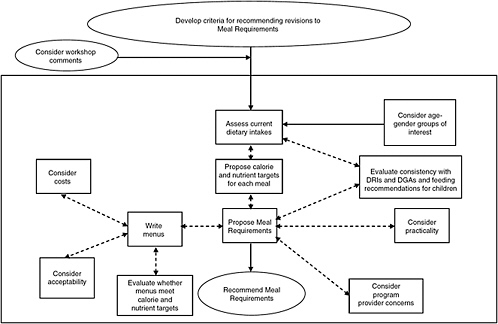
Figure 6-1 illustrates the process used by the committee in developing its recommendations for revisions to existing Meal Requirements for CACFP. The boxes and pathway in the center of the figure depict the major components of the committee’s approach. The boxes on the right and the left show the elements that were considered or evaluated as the committee applied its criteria to evolving recommendations.
The double arrows and dashed lines indicate the iterative steps in the process. For example, initial proposals for the Meal Requirements were evaluated to determine how well they aligned with current dietary guidance and were modified as necessary to enhance this consistency. Similar evaluations were undertaken to assess the practicality of proposed Meal Requirements as well as their suitability for use in planning menus that are consistent with the capabilities and resources of program providers.
After preliminary Meal Requirements were specified, two approaches were used to evaluate them. The first involved the development of meal composites that were revised to reflect the preliminary Meal Requirements (see “Development of Composite Food Items and Groups for Recommended Meal Requirements” in Appendix I). The second involved the writing of sample menus based on the Meal Requirements. Both the revised
TABLE 6-1 Age Groups Used to Develop CACFP Meal Requirements
|
Population Group |
Age Range |
|
Infants |
0–5 months |
|
|
6–11 months |
|
Children |
1 year |
|
|
2–4 years |
|
|
5–13 years |
|
Adolescents |
14–18 years |
|
Adults |
≥ 19 years |
meal composites and the menus were evaluated for cost and correspondence with the nutrient targets. The menus were also evaluated for acceptability and practicality. This resulted in some changes in the preliminary Meal Requirements. The end product of this iterative process was a set of recommendations for CACFP Meal Requirements.
ESTABLISHING CALORIE AND NUTRIENT TARGETS
The committee developed targets for calories and 24 nutrients and other dietary components for each of the seven specified age groups. These targets served as a guide for developing the new Meal Requirements and helped ensure that they would align well with the Dietary Reference Intakes (DRIs) (IOM, 1997, 1998, 2000, 2001, 2002/2005, 2005) and the 2005 Dietary Guidelines (HHS/USDA, 2005). In setting the targets, the committee used the approach developed and implemented by the School Meals committee (IOM, 2010). As described below, different approaches were used to develop targets for (1) calories, (2) nutrients with Estimated Average Requirements (EARs), (3) nutrients with Adequate Intakes (AIs), and (4) macronutrients. The targets vary by age group and eating occasion.
Calorie Targets
Estimated Energy Requirements
Before nutrient targets could be set for CACFP meals and snacks, it was essential to determine appropriate calorie targets. To do this, the committee first estimated the average daily energy requirements of several age groups of children and adults served by CACFP (see Chapter 3, Table 3-3). The committee used rounded overall means in setting calorie targets for specific meals and snacks and in other calculations related to the Meal Requirements. Of necessity, these calorie levels will be too high for some subgroups (mainly adolescent and older adult females) and too low for others. In using the overall mean, the committee sought to achieve a satisfactory balance between these two extremes, recognizing that gender-specific calorie targets are impractical for use in a group feeding program. As explained in the section “Food Intakes” in Chapter 5, adults ages 19 years and older were considered a single group with a daily calorie target of 2,000 calories per day. Likewise, the 5–10- and 11–13-year age groups were combined, and a mean calorie level of 1,900 calories per day was used in the analyses.
Distribution of Calories Across Eating Occasions
As a first step in setting target calorie levels for CACFP meals and snacks, the committee analyzed data from the National Health and Nutri-
tion Examination Survey (NHANES) 2003–2004 to determine, for each of six age groups, the average proportion of total daily calories consumed at breakfast, lunch, and dinner by individuals who reported these eating occasions. Results of this analysis are summarized in Table 6-2. After summing the percentage of calories consumed at the three meals, the remaining percentage was calculated and assumed to be available for consumption as snacks. On average, children and adults consume approximately 22 percent of their total daily calorie intake at breakfast, 31 percent at lunch, 35 percent at dinner, and the remainder in snacks. Compared with the other age groups, however, the youngest children (ages 1–4 years) consume a lower percentage of their calories at meals and a higher percentage at snacks. This reflects the fact that children in this age range tend to eat less at one sitting than older children and adults and, thus, eat more frequently during the day. When these children were considered separately, the average percentages of total calories per eating occasion (weighted proportionally by the
TABLE 6-2 Percentage of Energy Intake by Eating Occasion, Age, and Gender
TABLE 6-3 Proposed Distribution of Calories Across Eating Occasions for All Age Groups
years in each of the two youngest age groups) were 20, 26, and 26 percent for breakfast, lunch, and dinner, respectively, leaving 28 percent for snacks. For older children and adults, the corresponding percentages were 22, 31, and 35 percent, leaving 12 percent for snacks.
The committee applied information about the distribution of calories across eating occasions (Table 6-2) to the Estimated Energy Requirement (EER) rounded to the nearest MyPyramid calorie level for each of the child and adult age groups (Table 6-3) to identify target calorie levels for CACFP meals and snacks that are reasonably consistent with current eating patterns. The general formula used is shown in Box 6-2.
Table 6-3 summarizes the committee’s recommended calorie targets for each age group for the five possible CACFP eating occasions: breakfast, lunch, supper, and two snacks. For each meal and snack, the table shows both the absolute calorie target and the percentage of total calories. For children ages 5 years and older and adults, the calculated percentages for
|
Calories (kcal) |
|||||
|
14-18 Years |
19-59 Years |
≥ 60 Years |
|||
|
Males |
Females |
Males |
Females |
Males |
Females |
|
22 |
22 |
21 |
20 |
24 |
23 |
|
34 |
35 |
33 |
34 |
33 |
33 |
|
39 |
39 |
40 |
39 |
41 |
39 |
|
5 |
4 |
6 |
7 |
2 |
5 |
|
SOURCE: NHANES 2003–2004 for percent of calories at breakfast, lunch, and dinner by those consuming these meals. |
|||||
|
Dinner |
Snack 1 |
Snack 2 |
|||
|
Target Calorie Level (kcal) |
% of Total Calories |
Target Calorie Level (kcal) |
% of Total Calories |
Target Calorie Level (kcal) |
% of Total Calories |
|
247 |
26 |
133 |
14 |
133 |
14 |
|
338 |
26 |
182 |
14 |
182 |
14 |
|
608 |
32 |
133 |
7 |
133 |
7 |
|
608 |
32 |
133 |
7 |
133 |
7 |
|
768 |
32 |
168 |
7 |
168 |
7 |
|
640 |
32 |
140 |
7 |
140 |
7 |
|
640 |
32 |
140 |
7 |
140 |
7 |
|
BOX 6-2 Formula for Determining Target Calorie Levels for Meals and Snacks The general formula used to identify target calorie levels is Target meal calories = Mean energy requirement for age group × mean % of calories in meal. For example, for children ages 2–years, the NHANES data indicated that children in this age range obtain an average of 20 percent of total calories from breakfast. Using this information the target calorie level for breakfast for this age group was calculated as follows: Breakfast calories 1,300 calories × 0.2 = 260 calories. |
some of the eating occasions were adjusted slightly to 32 percent for lunch and supper and 14 percent for snacks. This was done to allow for more calories in snacks and, for reasons of practicality, to make the target calorie levels for lunch and supper the same.
The committee recognizes that some children and adults with limited access to food or with substantially higher calorie needs might benefit from meals or snacks that provide substantially more calories (and nutrients). In the committee’s view, however, this situation does not provide the basis for increasing the target calorie levels for CACFP meals and snacks. For children ages 5 years and older and for adults, however, the committee proposed an enhanced snack (see Chapter 7). In addition, family-style meal service, which currently is an option for child care facilities, offers the opportunity to balance the needs of those who need less food (because they are smaller or less hungry) with those who need more. To address the higher needs of vulnerable children and adults, child and adult care programs should use other mechanisms such as referrals to other community nutrition assistance programs (especially including the Supplemental Nutrition Assistance Program) to help ensure that they and their households have access to sufficient food.
Nutrient Targets for Protein, Vitamins, and Minerals
In setting the nutrient targets for CACFP meals and snacks, the committee followed the methodology developed and implemented by the School Meals committee (IOM,2010). This methodology—referred to as the “Target Median Intake Approach ”—was based on the methods recommended
for planning daily diets for groups in the report Dietary Reference Intakes: Applications in Dietary Planning (IOM, 2003).
Overview of the Target Median Intake Approach
The overall goal of planning intakes for groups of people is to achieve usual daily intakes within the group that meet the requirements of most individuals without being excessive (IOM, 2003). This goal is accomplished by combining information on the group’s usual nutrient intakes with information on the group’s nutrient requirements (expressed as either an EAR or AI and a Tolerable Upper Intake Level [UL]). The target nutrient intake distribution that is chosen aims to achieve the combined goal of a low predicted prevalence of nutrient inadequacy and a low predicted prevalence of excessive intakes. The median of this intake distribution is the Target Median Intake (TMI). The TMI was the starting point for the committee’s calculations to derive the nutrient targets for CACFP meals. The process for setting the initial TMIs for nutrients for children and adults differs depending on whether the nutrient has an EAR or an AI; both processes are described below. TMIs for nutrients are presented in Tables 6-4 and 6-5 for children and adults, respectively.
Setting Targets for Nutrients with an Estimated Average Requirement
Background For most nutrients with an EAR, the current prevalence of inadequacy may be estimated using the EAR cut-point method (IOM, 2006a). If the prevalence of inadequacy is too high, then one goal of the planning process is to reduce the prevalence of inadequacy to an acceptable level. Thus, one of the steps in planning for the nutrient intake of groups is to select the target prevalence of inadequacy. In keeping with the approach used previously by the School Meals committee, this committee set 5 percent rather than the more conservative 2 to 3 percent that has been suggested as an acceptable level of inadequacy (IOM, 2003).
The EARs used to determine the TMIs for children ages 5–10 and 11–13 years are weighted averages of two age groups. The use of weighted averages was necessary because these two age groups span parts of two DRI age groups (4–8 and 9–13 years). The weighting factor was the proportion of the 5-year age span. For example, for the age group 5–10 years, the weighted average was four-sixths (2/3) of the requirement for ages 4–8 years and two-sixths (1/3) of the requirement for ages 9–13 years.
Methodological approach The method recommended in Dietary Reference Intakes: Applications in Dietary Planning (IOM, 2003) involves determining the nutrient intake distributions that will result in approximately a 5
percent prevalence of inadequacy. Using this method, the committee shifted each current intake distribution upward or downward until approximately 5 percent of the group’s intakes were below the EAR. This method for determining the target distribution assumes that a change in the nutrient content of the daily diet would apply to everyone; thus, the distribution of usual nutrient intakes would shift without changing the shape of the distribution.1 Under this assumption, the appropriate change in the nutrient intake distribution was calculated as follows:
-
The 5th percentile of the intake distribution was positioned at the EAR.
-
The new median of the distribution was calculated as the original median plus the difference between the intake at the 5th percentile and the EAR.
If intake at the 5th percentile of the current intake distribution is above the EAR, the new median would be below the current median. The new median is the TMI for the day. The same method was used for all vitamins and minerals with an EAR except for iron (see discussion of iron below). For protein, the TMI is expressed in grams per kilogram of body weight (the EAR units for protein). To convert the value to grams of protein per day, it is necessary to assume a body weight for the children in each age-grade group. The committee used median body weights identified in NHANES 2003–2004 (see Chapter 3, Table 3-2) for the midpoint ages in each age group and averaged the weights for males and females. For the youngest children, the committee used median weights for comparable age groups in the report WIC Food Packages: Time for a Change (IOM, 2006b).
To illustrate the method, the vitamin C TMI for children ages 2–4 years is used as an example:
-
NHANES data show that vitamin C intakes at the 5th percentile are 30 mg per day.
-
The EAR for vitamin C (weighted average) is 16 mg per day.
Therefore, intakes at the 5th percentile exceed the EAR by an average of 14 mg per day, and there is no need to increase intakes. The TMI can be set at 14 mg per day less than the current median intake:
-
Current median intake is 89 mg per day.
-
The TMI is 75 mg per day (89–14).
Setting Targets for Nutrients with an Adequate Intake
Some nutrients have an AI rather than an EAR. Based on guidance from the report Dietary Reference Intakes: Applications in Dietary Planning (IOM, 2003), the committee assumed that a low prevalence of inadequacy would result if the median of the usual intake distribution was at least equal to the AI. Thus, for five nutrients with an AI (calcium, potassium, fiber, linoleic acid, and α-linolenic acid), the TMI was set at the AI. As was done with the EARs, weighted averages were used for the AIs for age groups 2–4 and 5–10 years. Although the derivation of the AI differs substantially among these nutrients and among different age-gender groups, the AI is still the most appropriate type of DRI to use to set the TMI.
Sodium The approach used to address sodium did not involve setting a TMI. Instead, the committee agreed to set maximum daily targets for sodium that are based on the age-specific ULs. This decision was made for several reasons. The NHANES (2003–2004) data demonstrated that the AIs for sodium are substantially lower than what children and adults consume, on average. Recognizing that sodium intake in the United States far exceeds the AI and also the UL, the sodium recommendation in the 2005 Dietary Guidelines for Americans (HHS/USDA, 2005) is 2.3 g per day—the value of the UL for persons 14 years and older. (The ULs for children younger than 14 years are slightly lower than 2.3 g per day.) Basing the sodium target on the UL rather than the AI is more consistent with achieving meals that are palatable and thus acceptable. For sodium, the goal would be to reduce the median intake to the UL.
Vitamin D A TMI was not set for vitamin D (which has an AI) because of a lack of reliable data on the vitamin D content of foods and on vitamin D intakes. Furthermore, vitamin D sources are highly variable and not under the control of CACFP providers.
Setting the Maximum for Saturated Fat and Cholesterol, Ranges for Total Fat, and Addressing trans Fat
Limiting the intakes of saturated fat, cholesterol, and trans fat helps support healthful levels of blood lipids. Avoiding excessive total fat intake also helps control saturated fat intake and helps avoid the intake of excessive calories. On the other hand, moderate intake of healthy fats (unsaturated vegetable oils, soft margarine, nuts, and seeds) helps ensure adequate intake of vitamin E and essential fatty acids, helps support a normal pattern of growth, and may help avoid undesirable changes in blood lipids (HHS/USDA, 2005).
TABLE 6-4 Daily CACFP Target Median Intakesa for Children Compared to MyPyramid Food Intake Patterns
|
Nutrient |
TMI for 1 Year |
1,000 calories/d MyPyramid Pattern |
TMI for 2–4 Yearsb |
|
Protein (g)d |
27 |
42 |
40 |
|
Vitamin A (µg RAE) |
431 |
455 |
462 |
|
Vitamin C (mg) |
71 |
73 |
76 |
|
Vitamin E (mg αT) |
6.5 |
4.5 |
7.1 |
|
Thiamin (mg) |
0.82 |
1.0 |
0.90 |
|
Riboflavin (mg) |
1.2 |
1.5 |
1.21 |
|
Niacin (mg) |
10.3 |
9.7 |
11.8 |
|
Vitamin B6 (mg) |
0.90 |
1.1 |
0.98 |
|
Folate (µg DFE) |
271 |
306 |
316 |
|
Vitamin B12 (µg) |
2.7 |
4.3 |
2.8 |
|
Iron (mg) |
7.4 |
7.6 |
8.5 |
|
Magnesium (mg) |
131 |
180 |
148 |
|
Zinc (mg) |
5.4 |
6.6 |
6.3 |
|
Calcium (mg) |
500 |
782 |
600 |
|
Phosphorus (mg) |
780 |
905 |
836 |
|
Potassium (mg) |
3,000 |
1,988 |
3,267 |
|
Sodium (mg)f |
1,500 |
869 |
1,633 |
|
Linoleic acid (g) |
7.0 |
9.3 |
8.0 |
|
α-linolenic acid (g) |
0.70 |
0.9 |
0.77 |
|
Fiber (g) |
19.0 |
13.0 |
21.0 |
|
NOTE: The goal is to offer diets that provide at least the amount of nutrient listed in the TMI column for each age group. The MyPyramid columns show the amount of each nutrient that the pattern would provide given the target calorie level for the age group. αT = α-tocopherol; d = day; DFE = dietary folate equivalent; g = gram; kg = kilogram; µg = microgram; mg = milligram; RAE = retinol activity equivalent; TMI = Target Median Intake. aTMIs are calculated based on a 5% prevalence of inadequacy for nutrients with an EAR. Those shown in bold font are higher than the amounts provided by the MyPyramid pattern. bTMIs shown for the 2–4-year-old and 5–10-year-old age groups are calculated using weighted averages of the EARs and AIs for two DRI age groups. cThe 1,300-calories-per-day pattern is an average of the 1,200- and 1,400-calorie patterns; the 1,900-calories-per-day pattern is an average of the 1,800- and 2,000-calorie patterns. |
|||
The committee relied on recommendations from 2005 Dietary Guidelines (HHS/USDA, 2005) to set a target maximum intake for saturated fat and cholesterol (substances in food that are not essential nutrients) and ranges of intake for total fat (IOM, 2002/2005). In particular, the Dietary Guidelines recommends a fat intake of 25 to 35 percent of total calories, less than 10 percent of calories from saturated fatty acids (which are abundant in the fat in dairy products and meat), and a maximum of 300 mg of cholesterol per day for all individuals over the age of 2 years (HHS/USDA,
|
1,300 calories/d MyPyramid Patternc |
TMI for 5-13 Yearsb |
1,900 calories/d MyPyramid Patternc |
TMI for 14-18 Years |
2,400 calories/d MyPyramid Pattern |
|
59 |
92 |
89 |
97 |
105 |
|
639 |
670 |
1,032 |
847 |
1,126 |
|
96 |
89 |
143 |
116 |
163 |
|
5.9 |
10.3 |
9.1 |
16.4 |
10.7 |
|
1.4 |
1.2 |
2.0 |
1.7 |
2.4 |
|
1.9 |
1.6 |
2.8 |
2.0 |
3.1 |
|
15.0 |
15.3 |
21.4 |
19.8 |
27.3 |
|
1.6 |
1.4 |
2.4 |
1.8 |
2.9 |
|
445 |
442 |
682 |
631 |
822 |
|
5.5 |
3.7 |
8.2 |
4.6 |
9.2 |
|
11.6 |
10.5e |
17.3 |
18.6 |
21.5 |
|
244 |
254 |
372 |
440 |
440 |
|
9.4 |
10.0 |
14.0 |
12.5 |
16.7 |
|
866 |
1,198 |
1,309 |
1,504 |
1,388 |
|
1,142 |
1,287 |
1,716 |
1,713 |
1,961 |
|
2,568 |
4,596 |
3,914 |
5,438 |
4,523 |
|
1,227 |
2,265 |
1,750 |
2,025 |
2,136 |
|
11.6 |
11.4 |
16.8 |
14.1 |
20.9 |
|
1.1 |
1.1 |
1.7 |
1.4 |
2.0 |
|
19.5 |
29.0 |
30.0 |
33.5 |
37.0 |
|
dAssumes body weights of 11.6 kg for children age 1 year, 16.1 kg for children age 2 years, 30.6 kg for males ages 5–10 years, 31.2 kg for females ages 5–10 years, 54.3 kg for males ages 11–13 years, 53.6 kg for females ages 11–13 years, 73.0 kg for males ages 14–18 years, and 63.2 kg for females ages 14–18 years (NHANES 2003–2004). eMethods used to calculate iron values for females 11–13 years old are described in Chapter 4. fSodium TMIs are based on the Tolerable Upper Intake Levels (UL). SOURCE: Nutrient values in columns representing the MyPyramid patterns are from Britten et al., 2006. |
||||
2005). The committee used these values as the basis for the fat targets for CACFP meals and snacks. For children 1 year of age, a more liberal allowance (30 to 40 percent of total calories) was used for total fat. The goal was to keep saturated fat and cholesterol as low as practical. These targets are consistent with the goals defined for this age group in Dietary Reference Intakes (IOM, 2002/2005). The committee considered the Dietary Guidelines plus supplementary information to address whether it would be possible to set a target maximum for trans fat (see Box 6-3).
TABLE 6-5 Daily Target Median Intakesa for Adults Compared to MyPyramid Food Intake Patterns
|
Nutrient |
TMI for ≥ 19 Yearsc |
2,000 calories/d MyPyramid pattern |
|
Protein (g)b |
104 |
91 |
|
Vitamin A (µg RAE) |
988 |
1,052 |
|
Vitamin C (mg) |
135 |
155 |
|
Vitamin E (mg αT) |
18.5 |
9.5 |
|
Thiamin (mg) |
1.8 |
2.0 |
|
Riboflavin (mg) |
2.1 |
2.8 |
|
Niacin (mg) |
22.6 |
21.9 |
|
Vitamin B6 (mg) |
2.5 |
2.4 |
|
Folate (µg DFE) |
647 |
695 |
|
Vitamin B12 (µg) |
5.0 |
8.3 |
|
Iron (mg) |
12.6 |
17.5 |
|
Magnesium (mg) |
451 |
380 |
|
Zinc (mg) |
13.6 |
14.3 |
|
Calcium (mg) |
1,519 |
1,316 |
|
Phosphorus (mg) |
1,231 |
1,740 |
|
Potassium (mg) |
5,950 |
4,044 |
|
Sodium (mg)d |
1,873 |
1,779 |
|
Linoleic acid (g) |
13.9 |
17.7 |
|
α-linolenic acid (g) |
1.5 |
1.7 |
|
Fiber (g) |
29.0 |
31.0 |
|
NOTE: The goal is to offer diets that provide at least the amount of nutrient listed in the TMI column for each age group. The MyPyramid columns show the amount of each nutrient that the pattern would provide given the target calorie level for the age group. αT = α-tocopherol; d = day; DFE = dietary folate equivalent; g = gram; kg = kilogram; µg = microgram; mg = milligram; RAE = retinol activity equivalent; TMI = Target Median Intake. aTMIs are calculated based on a 5% prevalence of inadequacy for nutrients with an EAR. Those shown in bold font are higher than the amounts provided by the MyPyramid pattern. bAssumes body weights of 88.0 for males ages 19–59 years, 75.3 kg for females ages 19–59 years, 87.3 kg for males ages ≥ 60 years, and 73.0 kg for females ages ≥ 60 years (NHANES 2003–2004). cThese TMIs shown for the 19–59-year-old age group are calculated using weighted averages of the EARs or AIs for multiple DRI age groups. dSodium TMIs are based on the Tolerable Upper Intake Levels (UL). SOURCE: Nutrient values in columns representing the MyPyramid patterns are from Britten et al., 2006. |
||
Calculating Target Median Intakes for CACFP Age Groups
To incorporate the TMI concept into the setting of the nutrient targets for CACFP meals and snacks, the committee first addressed the fact that, for some age groups, nutrient needs differ substantially for males and females. The committee aimed to calculate targets for total daily intake that would best reflect these differences in nutrient needs. The committee used the simple nutrient density approach, as implemented by the School Meals
|
BOX 6-3 trans Fats The Dietary Guidelines for Americans (HHS/USDA) recommends that trans fat intake be kept as low as possible, but it does not specify a maximum level of intake. In turn, no data exist on which to base a maximum level for trans fat in CACFP meals and snacks, even though the goal is essentially zero grams. Nonetheless, a practical method can be used to keep the trans fat content of CACFP meals to a minimum. In particular, this is achievable by specifying that, for any food included on the menu, zero grams of trans fat per serving would be the maximum amount of trans fat listed on the nutrition label. This method is not always applicable because some products, such as bakery items produced by manufacturers who qualify as small businesses, are exempted from nutrition labeling, and thus the trans fat content of the product may not be specified. The committee notes that foods labeled as containing zero grams of trans fat may actually contain a small amount (< 0.5 grams) of trans fat per serving. |
committee to combine the TMIs by gender for each age group.2,3 Using this approach for males and females separately within each of the age groups beginning at 5 years, the committee calculated the nutrient density (the ratio of the gender-specific TMI to the gender-specific EER) that is shown in Table 6-2. It then multiplied the higher density times the mean EER for the age group to obtain the candidate TMI. This approach was not necessary for children under 5 years of age because males and females have similar intakes and requirements.
Comparing Daily CACFP Target Median Intakes with MyPyramid Food Patterns
Because the MyPyramid food patterns were designed to meet the 2005 Dietary Guidelines (HHS/USDA, 2005), potentially they could provide a sound basis for recommended meal and snack patterns for CACFP. To test this, the committee compared the daily CACFP TMIs for each age group with the nutrient content of the MyPyramid food pattern for the corresponding daily calorie target, as also shown in Tables 6-4 and 6-5.For
almost all nutrients, the CACFP TMI value was lower than the amount that would be obtained by following the MyPyramid pattern for the calorie level set for each age group. That is, providing meals that are based on the MyPyramid pattern provides nutrients in amounts that are close to or exceed the nutrient targets while helping achieve alignment with the Dietary Guidelines.
For most age groups of children, vitamin E and potassium are the only nutrients that would be provided by the MyPyramid pattern in amounts below the CACFP TMI. For age groups 1 and 2–4 years, fiber amounts would also be somewhat below the CACFP TMI. For the 14–18-year age group, calcium amounts would also be lower than the CACFP TMI.
The comparison is slightly less favorable for the adults (see Table 6-5). In particular, the MyPyramid pattern provides protein, vitamin E, magnesium, calcium, and potassium in amounts that are substantially below the CACFP TMI. When the totality of nutrients were considered, however, the committee concluded that following a meal pattern based on MyPyramid would provide adequate nutrient levels to adult CACFP participants for the meals and snacks served.
Converting Daily CACFP Target Median Intakes to Meal and Snack Nutrient Targets
The CACFP TMIs (Tables 6-4 and 6-5) are for total daily intake. However, each CACFP meal and snack provides only a portion of the day’s intake. As described earlier in this chapter, the committee set targets for the percentage of total calories to be provided by the CACFP meals and snacks (see Table 6-3). In developing recommendations for the calorie targets for CACFP meals and snacks, the committee multiplied the CACFP TMIs by the percentages in Table 6-3 to obtain nutrient targets for the meals. For example, the targets for breakfast for the 2–4-year age group represent 20 percent of the respective CACFP TMIs, and the targets for lunch for the same age group represent 26 percent. Daily nutrient targets averaged over a 5-day week for CACFP meals and snacks appear in Appendix Tables J-1 through J-3. The committee multiplied the sodium UL by the calorie percentages in Table 6-3 to obtain preliminary maximum intakes rather than nutrient targets.
The committee recognizes that the target nutrient intake distribution would be achieved only if participants’ intakes from CACFP meals and snacks were accompanied by similar changes in the nutrient intakes from foods consumed outside the program. That is, the recommended amounts of nutrients from the CACFP meals and snacks would need to be consumed, and comparable intakes would have to be sustained across the full day’s intake, in order to meet the CACFP TMI and achieve no greater than 5 percent preva-
lence of inadequacy. Nonetheless, it is desirable to set nutrient targets for CACFP meals and snacks to provide a scientific basis for the Meal Requirements and also to serve as a model for the meals and snacks served in other child and adult care settings. Even if only an afterschool snack is served by CACFP, the types and amounts of the foods may promote the desire for, and acceptance of, a higher quality diet throughout the rest of the day.
Considering the Tolerable Upper Intake Level in Setting Nutrient Targets
The committee examined the possibility that, for some nutrients, the prevalence of intakes above the UL would be undesirably high if the CACFP TMIs were achieved for the full day’s intake. Using NHANES (2003–2004) data, an adjusted intake at the 95th percentile was calculated assuming that the median intake of a nutrient changed to be equal to the CACFP TMI and that the whole distribution (including the 95th percentile) would change by the same amount. For these analyses, intakes of 5–10-year-olds were not combined with those of 11–13-year-olds, nor were intakes of younger (19–59 years) and older (> 60 years) adults; calculations were performed separately for males and females within each age group. This same method was used for nutrients with an EAR and for nutrients with an AI.
For each age group, the adjusted intake at the 95th percentile was compared to the UL, if any. (Magnesium was excluded because the UL is only for pharmacological agents. The UL does not apply to magnesium in foods [IOM, 1997].) For children ages 5–10 years, the UL for the younger DRI age group (6–8 years)—the most conservative value—was used. For several nutrients, the ULs are considerably lower for children ages 8 years or younger than for older children.
The results are shown in Tables 6-6 and 6-7. For each age group, there were some nutrients with the adjusted 95th percentile of intakes above the UL, meaning that at least 5 percent of CACFP participants would have intakes above the UL if the median intake was at the CACFP TMI, as follows:
-
1-year-olds: vitamin A, niacin, folate, zinc, and sodium
-
2–4-year-olds: vitamin A, niacin, folate, zinc, and sodium
-
5–10-year-olds: vitamin A, niacin, folate, zinc, and sodium for males and females
-
11–13-year-olds: niacin, folate, and sodium for males and females
-
14–18-year-olds: niacin, folate, and sodium for males and females
-
19–59-year-olds: folate and sodium for males and females; niacin for males
-
60-year-olds and older: sodium for males and females; niacin and folate for males
TABLE 6-6 Children: Tolerable Upper Intake Level (UL) for Nutrients with a UL,* Reported Intakes,**a and Predicted Adjusted Intakes at the 95th Percentile, and Adjusted Intakes as a Percentage of the UL, by Age-Gender Group
|
Nutrient (unit) |
1 Year |
2–4 Years |
||||||
|
Males and Females |
Males and Females |
|||||||
|
ULb |
Intake at 95th |
Adj. Intake at 95th |
Adj. Intake as % of UL |
ULb |
Intake at 95th |
Adj. Intake at 95th |
Adj. Intake as % of UL |
|
|
Vitamin A (µg RAE/d) |
600 |
883 |
831 |
138 |
600 |
878 |
840 |
140 |
|
Vitamin C (mg/d) |
400 |
212 |
190 |
48 |
400 |
207 |
194 |
48 |
|
Vitamin E (mg αT/d) |
200 |
6.5 |
9.4 |
5 |
200 |
6.8 |
9.9 |
5 |
|
Niacin (mg/d) |
10.0 |
21.4 |
18.6 |
186 |
10.0 |
24.4 |
21.5 |
215 |
|
Vitamin B6 (mg/d) |
30.0 |
2.2 |
1.8 |
6 |
30.0 |
2.4 |
2.0 |
7 |
|
Folate (µg DFE/d) |
300 |
637 |
550 |
183 |
300 |
735 |
655 |
218 |
|
Iron (mg/d) |
40.0 |
17.9 |
15.0 |
38 |
40.0 |
19.4 |
16.5 |
41 |
|
Magnesium (mg/d) |
65 |
278 |
225 |
346 |
65 |
286 |
243 |
375 |
|
Zinc (mg/d) |
7.0 |
12.4 |
9.9 |
142 |
7.0 |
13.7 |
11.5 |
164 |
|
Calcium (mg/d) |
2,500 |
1,590 |
1,135 |
45 |
2,500 |
1,591 |
1,224 |
49 |
|
Phosphorus (mg/d) |
3,000 |
1,603 |
1,334 |
44 |
3,000 |
1,623 |
1,375 |
46 |
|
Sodium (mg/d) |
1,500 |
3,233 |
2,731 |
182 |
1,500 |
3,629 |
3,050 |
203 |
|
|
Males |
Females |
||||||
|
|
5–10 Years |
|||||||
|
Vitamin A (µg RAE/d) |
900 |
909 |
1,016 |
113 |
900 |
863 |
996 |
111 |
|
Vitamin C (mg/d) |
650 |
179 |
191 |
29 |
650 |
175 |
187 |
29 |
|
Vitamin E (mg αT/d) |
300 |
8.8 |
13.9 |
5 |
300 |
8.0 |
13.3 |
4 |
|
Niacin (mg/d) |
15.0 |
31.9 |
26.9 |
179 |
15.0 |
28.0 |
24.2 |
161 |
|
Vitamin B6 (mg/d) |
40.0 |
2.6 |
2.4 |
6 |
40.0 |
2.4 |
2.3 |
6 |
|
Folate (µg DFE/d) |
400 |
968 |
874 |
218 |
400 |
828 |
760 |
190 |
|
Iron (mg/d) |
40.0 |
22.8 |
18.4 |
46 |
40.0 |
20.7 |
17.3 |
43 |
|
Magnesium (mg/d) |
110 |
329 |
362 |
329 |
110 |
297 |
342 |
311 |
|
Zinc (mg/d) |
12.0 |
18.3 |
17.4 |
145 |
12.0 |
15.0 |
14.9 |
124 |
|
Calcium (mg/d) |
2,500 |
1,620 |
1,822 |
73 |
2,500 |
1,557 |
1,816 |
73 |
|
Phosphorus (mg/d) |
3,000 |
1,836 |
1,873 |
62 |
3,000 |
1,690 |
1,816 |
61 |
|
Sodium (mg/d) |
1,900 |
4,553 |
3,772 |
199 |
1,900 |
4,132 |
3,576 |
188 |
|
Nutrient (unit) |
Males |
Females |
||||||
|
11–13 Years |
||||||||
|
ULb |
Intake at 95th |
Adj. Intake at 95th |
Adj. Intake as % of UL |
ULb |
Intake at 95th |
Adj. Intake at 95th |
Adj. Intake as % of UL |
|
|
Vitamin A(µg RAE/d) |
1,700 |
1,005 |
1,114 |
66 |
1,700 |
802 |
978 |
58 |
|
Vitamin C (mg/d) |
1,200 |
157 |
169 |
14 |
1,200 |
151 |
163 |
14 |
|
Vitamin E (mg αT/d) |
600 |
10.3 |
14.1 |
2 |
600 |
8.9 |
13.7 |
2 |
|
Niacin (mg/d) |
20.0 |
35.8 |
28.0 |
140 |
20.0 |
28.9 |
24.9 |
125 |
|
Vitamin B6 (mg/d) |
60 |
2.8 |
2.4 |
4 |
60 |
2.3 |
2.2 |
4 |
|
Folate (µg DFE/d) |
600 |
1,046 |
892 |
149 |
600 |
763 |
702 |
117 |
|
Iron (mg/d) |
40.0 |
24.8 |
18.6 |
47 |
40.0 |
20.2 |
17.0 |
42 |
|
Magnesium (mg/d) |
350 |
368 |
376 |
107 |
350 |
300 |
347 |
99 |
|
Zinc (mg/d) |
23.0 |
21.3 |
18.4 |
80 |
23.0 |
14.1 |
14.4 |
63 |
|
Calcium (mg/d) |
2,500 |
1,704 |
1,831 |
73 |
2,500 |
1,438 |
1,759 |
70 |
|
Phosphorus (mg/d) |
4,000 |
1,987 |
1,880 |
47 |
4,000 |
1,658 |
1,812 |
45 |
|
Sodium (mg/d) |
2,200 |
5,006 |
3,747 |
170 |
2,200 |
4,384 |
3,124 |
142 |
|
|
Males |
Females |
||||||
|
|
14–18 Years |
|||||||
|
Vitamin A (µg RAE/d) |
2,800 |
1,141 |
1,428 |
51 |
2,800 |
869 |
1,262 |
45 |
|
Vitamin C (mg/d) |
1,800 |
204 |
240 |
13 |
1,800 |
161 |
211 |
12 |
|
Vitamin E (mg αT/d) |
800 |
12.8 |
22.7 |
3 |
800 |
9.5 |
20.3 |
3 |
|
Niacin (mg/d) |
30.0 |
41.5 |
34.7 |
116 |
30.0 |
28.0 |
28.1 |
94 |
|
Vitamin B6 (mg/d) |
80 |
3.5 |
3.3 |
4 |
80 |
2.4 |
2.7 |
3 |
|
Folate (µg DFE/d) |
800 |
1,225 |
1,244 |
155 |
800 |
857 |
1,008 |
126 |
|
Iron (mg/d) |
45.0 |
31.7 |
32.2 |
72 |
45.0 |
21.2 |
26.4 |
59 |
|
Magnesium (mg/d) |
350 |
473 |
638 |
182 |
350 |
329 |
561 |
160 |
|
Zinc (mg/d) |
34.0 |
22.9 |
21.1 |
62 |
34.0 |
15.5 |
18.0 |
53 |
|
Calcium (mg/d) |
2,500 |
2,103 |
2,467 |
99 |
2,500 |
1,385 |
2,074 |
83 |
|
Phosphorus (mg/d) |
4,000 |
2,487 |
2,653 |
66 |
4,000 |
1,702 |
2,277 |
57 |
|
Sodium (mg/d) |
2,300 |
6,212 |
4,287 |
186 |
2,300 |
4,255 |
3,270 |
142 |
|
NOTES: αT = α-tocopherol; d = day; DFE = dietary folate equivalent; g = gram; kg = kilogram; µg = microgram; mg = milligram; RAE = retinol activity equivalent. Bold font indicates intake values above the UL. aIntakes exclude contributions from nutrient supplements. bThe UL listed is the lowest UL value within the age-gender group. SOURCES: *IOM, 2006a; **NHANES 2003–2004. |
||||||||
TABLE 6-7 Adults: Tolerable Upper Intake Level (UL) for Nutrients with a UL,* Reported Intakes,**a and Predicted Adjusted Intakes at the 95th Percentile, and Adjusted Intakes as a Percentage of the UL, by Age-Gender Group
|
Nutrient (unit) |
Males |
Females |
||||||
|
19–59 Years |
||||||||
|
ULb |
Intake at 95th |
Adj. Intake at 95th |
Adj. Intake as % of UL |
ULb |
Intake at 95th |
Adj. Intake at 95th |
Adj. Intake as % of UL |
|
|
Vitamin A (µg RAE/d) |
3,000 |
1,268 |
1,651 |
55 |
3,000 |
987 |
1,498 |
50 |
|
Vitamin C (mg/d) |
2,000 |
209 |
263 |
13 |
2,000 |
187 |
250 |
13 |
|
Vitamin E (mg αT/d) |
1,000 |
13.8 |
24.5 |
2 |
1,000 |
10.9 |
23.2 |
2 |
|
Niacin (mg/d) |
35.0 |
46.7 |
39.1 |
112 |
35.0 |
30.9 |
33.8 |
96 |
|
Vitamin B6 (mg/d) |
100 |
3.6 |
3.9 |
4 |
100 |
2.7 |
3.6 |
4 |
|
Folate (µg DFE/d) |
1,000 |
1,067 |
1,108 |
111 |
1,000 |
838 |
1,035 |
103 |
|
Iron (mg/d) |
45.0 |
30.4 |
24.8 |
55 |
45.0 |
21.6 |
21.1 |
47 |
|
Magnesium (mg/d) |
350 |
520 |
647 |
185 |
350 |
381 |
605 |
173 |
|
Zinc (mg/d) |
40.0 |
23.3 |
22.3 |
56 |
40.0 |
16.5 |
20.3 |
51 |
|
Calcium (mg/d) |
2,500 |
1,866 |
2,383 |
95 |
2,500 |
1,390 |
2,151 |
86 |
|
Phosphorus (mg/d) |
4,000 |
2,475 |
2,074 |
52 |
4,000 |
1,807 |
1,910 |
48 |
|
Sodium (mg/d) |
2,300 |
6,534 |
4,126 |
179 |
2,300 |
4,570 |
3,398 |
148 |
|
≥ 60 Years |
||||||||
|
Vitamin A (µg RAE/d) |
3,000 |
1,497 |
1,894 |
63 |
3,000 |
1,027 |
1,470 |
49 |
|
Vitamin C (mg/d) |
2,000 |
177 |
238 |
12 |
2,000 |
163 |
229 |
11 |
|
Vitamin E (mg αT/d) |
1,000 |
13.8 |
25.9 |
3 |
1,000 |
10.4 |
23.4 |
2 |
|
Niacin (mg/d) |
35.0 |
37.8 |
36.5 |
104 |
35.0 |
29.4 |
22.6 |
65 |
|
Vitamin B6 (mg/d) |
100 |
3.2 |
3.8 |
4 |
100 |
2.5 |
3.5 |
4 |
|
Folate (µg DFE/d) |
1,000 |
950 |
1,080 |
108 |
1,000 |
749 |
983 |
98 |
|
Iron (mg/d) |
45.0 |
27.4 |
24.2 |
54 |
45.0 |
20.3 |
20.7 |
46 |
|
Magnesium (mg/d) |
350 |
447 |
618 |
177 |
350 |
356 |
584 |
167 |
|
Zinc (mg/d) |
40.0 |
19.6 |
21.7 |
54 |
40.0 |
15.1 |
20.1 |
50 |
|
Calcium (mg/d) |
2,500 |
1,478 |
2,200 |
88 |
2,500 |
1,260 |
2,125 |
85 |
|
Phosphorus (mg/d) |
3,000 |
2,031 |
1,990 |
66 |
3,000 |
1,552 |
1,797 |
60 |
|
Sodium (mg/d) |
2,300 |
5,293 |
3,917 |
170 |
2,300 |
3,956 |
3,274 |
142 |
|
NOTES: αT = α-tocopherol; d = day; DFE = dietary folate equivalent; g = gram; kg = kilogram; µg = microgram; mg = milligram; RAE = retinol activity equivalent. Bold font indicates intake values above the UL. aIntakes exclude contributions from nutrient supplements. bThe UL listed is the lowest UL value within the age-gender group. SOURCES: *IOM, 2006a; **NHANES 2003–2004. |
||||||||
It is worth noting that, in most of these cases, current intakes at the 95th percentile also exceed the UL. As would be expected, at the 95th percentile of intake, all values for sodium are well above the UL. For most nutrients, intakes above the UL are not likely to be a concern. This is largely because the ULs only apply to certain forms or sources of nutrients, whereas the intake estimates are for the total diet. For example, the vitamin A UL applies only to preformed retinol, and the niacin and folate ULs apply only to these nutrients in fortified foods and supplements. These issues are discussed in more detail in the School Meals report (IOM, 2010).
DEVELOPING MEAL REQUIREMENTS
The Meal Requirements provide standards for CACFP meals and snacks that serve two purposes: (1) providing patterns and specifications for menus that are consistent with the Dietary Guidelines and the nutrient targets, and (2) identifying what qualifies as a meal that is eligible for federal financial reimbursement. The following discussion describes the iterative processes (see Figure 6-1) used to develop recommendations for the Meal Requirements. The committee’s final recommendations for CACFP Meal Requirements are presented in Chapter 7.
The Approach
The process used in developing recommended Meal Requirements built on the approach used by the School Meals committee. The approach uses MyPyramid food intake patterns to provide a basis for planning menus that are consistent with the Dietary Guidelines and that provide nutrients in amounts that equal or exceed the CACFP TMIs, with two exceptions—vitamin E and potassium. The MyPyramid patterns specify amounts of foods from six major food groups and seven food subgroups—a larger number of food groups than currently used for planning CACFP meals and snacks4 but a number judged workable by the committee.
Developing Meal Patterns
The process of developing meal patterns for individuals, ages 2 years and older, included (1) calculations to determine amounts that would be consistent with MyPyramid food patterns for specified calorie levels and (2) the evaluation of the patterns in terms of nutrient content, cost, and acceptability. These steps are described below. The approach used for infants
and children younger than 2 years appears in the later section “Developing Meal Patterns for Infants.”
Calculation of Meal Patterns
The MyPyramid food patterns at selected calorie levels were used as the basis to calculate the 5-day amounts of each food group to be served in CACFP. Daily amounts are provided for the major food groups. Therefore, each amount was multiplied by five to calculate the serving sizes over 5 days within the CACFP program. However, because the amounts for the vegetable subgroups in the MyPyramid patterns are provided for a 7-day week, each weekly amount was multiplied by 5/7 to achieve the correct serving size for 5 days in a CACFP meal pattern. For example, in the 1,800-calorie MyPyramid pattern, 3 cups of dark green vegetables should be served weekly (over 7 days). To determine the amount of these vegetables to be served over 5 days, 3 cups was multiplied by 5/7, which equals 2.1 cups of dark green vegetables. Rounding, which is necessary for a practical pattern, occurred at a later step in the process.
The percentage of calories assigned by the committee for each eating occasion was then applied to the 5-day pattern for every food group and subgroup to determine the distribution of food groups for breakfast, lunch and supper, and snacks. This approach kept the food group amounts proportional to the number of calories specified for the meal.
The committee adapted a set of menu development spreadsheets that had been developed by the School Meals committee (IOM, 2010) and used these to test, in an iterative fashion, possible meal patterns against the nutrient targets presented in Tables 6-4 and 6-5. (For a description of the approach and methodology see IOM [2010].) Adjustments to the food groups and serving sizes at each eating occasion were made when necessary to develop a more practical menu pattern.
Writing Menus and Testing Meal Patterns
In the process of developing the meal patterns, the writing of menus based on initial patterns posed practical problems. This led to some adjustment of the patterns. The menu development spreadsheets provided basic information on how the pattern adjustments affected the nutrient content. The methods used for estimating nutrient contents are described in Appendix G. The menus that are based on the recommended patterns appear in Appendix K. Early estimates of the nutrient content of menus reinforced the need to recommend specifications for the types of food items that belong to the five meal components. Information about cost appears in Chapter 8.
Developing Meal Patterns for Infants
For infants and children under 2 years of age, the committee referred to the report WIC Food Packages (IOM, 2006b) for food group priorities and nutrient priorities and summarized them in Chapter 4 of this report. The development of meal patterns for the two youngest age groups (0–5 months and 6–11 months) relied primarily on (1) the dietary guidance from the American Academy of Pediatrics (AAP) as presented in Chapter 3, (2) the recommendations for infant food packages in the report WIC Food Packages: Time for a Change (IOM, 2006b, Table 6-6), and (3) the specifications for infant foods in that report (IOM, 2006b, Appendix B, Table B-1). The development of meal patterns for 1-year-old children relied on guidance from the AAP, the WIC child food packages (IOM, 2006b, Table 6-4), and MyPyramid (USDA, 2010).
SUMMARY
The process for developing revised Meal Requirements for the CACFP began with the development of criteria and involved five complex steps including the setting of parameters, assessment of dietary intake, setting of nutrient targets, developing meal patterns and food specifications, and using the criteria to iteratively evaluate and finalize the Meal Requirement recommendations. The next chapter presents the committee’s recommendations for meal patterns and food specifications.
REFERENCES
Britten, P., K. Marcoe, S. Yamini, and C. Davis. 2006. Development of food intake patterns for the MyPyramid Food Guidance System. Journal of Nutrition Education and Behavior 38(6 Suppl):S78–S92.
HHS/USDA (U.S. Department of Health and Human Services/U.S. Department of Agriculture). 2005. Dietary Guidelines for Americans, 6th ed. Washington, DC: U.S. Government Printing Office. http://www.health.gov/DietaryGuidelines/dga2005/document/ (accessed July 23, 2008).
IOM (Institute of Medicine). 1997. Dietary Reference Intakes for Calcium, Phosphorus, Magnesium, Vitamin D, and Fluoride. Washington, DC: National Academy Press.
IOM. 1998. Dietary Reference Intakes for Thiamin, Riboflavin, Niacin, Vitamin B6, Folate, Vitamin B12, Pantothenic Acid, Biotin, and Choline. Washington, DC: National Academy Press.
IOM. 2000. Dietary Reference Intakes for Vitamin C, Vitamin E, Selenium, and Carotenoids. Washington, DC: National Academy Press.
IOM. 2001. Dietary Reference Intakes for Vitamin A, Vitamin K, Arsenic, Boron, Chromium, Copper, Iodine, Iron, Manganese, Molybdenum, Nickel, Silicon, Vanadium, and Zinc. Washington, DC: National Academy Press.
IOM. 2002/2005. Dietary Reference Intakes for Energy, Carbohydrate, Fiber, Fat, Fatty Acids, Cholesterol, Protein, and Amino Acids. Washington, DC: The National Academies Press.
IOM. 2003. Dietary Reference Intakes: Applications in Dietary Planning. Washington, DC: The National Academies Press.
IOM. 2005. Dietary Reference Intakes for Water, Potassium, Sodium, Chloride, and Sulfate. Washington, DC: The National Academies Press.
IOM. 2006a. Dietary Reference Intakes: The Essential Guide to Nutrient Requirements. Washington, DC: The National Academies Press.
IOM. 2006b. WIC Food Packages: Time for a Change. Washington, DC: The National Academies Press.
IOM. 2010. School Meals: Building Blocks for Healthy Children. Washington, DC: The National Academies Press.


